|
 |

What Does This Report Mean?
Interpreting Your Category Cable Test Report
Your cable test report is generated by our Fluke DTX-1800 Cable Tester and the associated Fluke LinkWare software. To explain how this test report is generated, and what the meaning of the values and graphs shown on it is, we first need to touch upon the specifications just a bit.
The Fluke tester supports two sets of specifications for Cat 5e and 6 patch cords: the TIA and the ISO specs. The ISO spec is somewhat stricter than the TIA. In the case of Cat6a patch cords, the tester supports only the ISO specs. We will sell a cable which meets either the TIA or the ISO spec; in the vast majority of cases, our cables meet the stricter ISO spec.
The specification limits for return loss are not linked to the cable length in any way; the same pass/fail limits apply to any length of cable. This is not the case, however, with crosstalk (NEXT). The specification limits for crosstalk vary with length, becoming more relaxed for longer cables. Over short changes in distance, the changes to the limits are small, and Fluke recommends that we test against a limit set slightly longer than, rather than shorter than, the cable under test. Any possibility of giving a "pass" to a cable which actually fails, however, is eliminated by the fact that Fluke builds into these limit sets a margin of error parameter and will alert the test operator (and show on the test report) if a test is within the tester's statistical margin of error (and therefore not an iron-clad certain pass). We won't sell a cable unless it produces a test result that's outside the margin of error, which is much larger than the difference between adjacent limit sets. In the case of a Cat 6 or 6a patch cord exceeding 20m, we test against the 20m standard as we do not have programmed "limit sets" for longer cables.
Here is a sample test report, with some of the most significant items numbered for explanation.
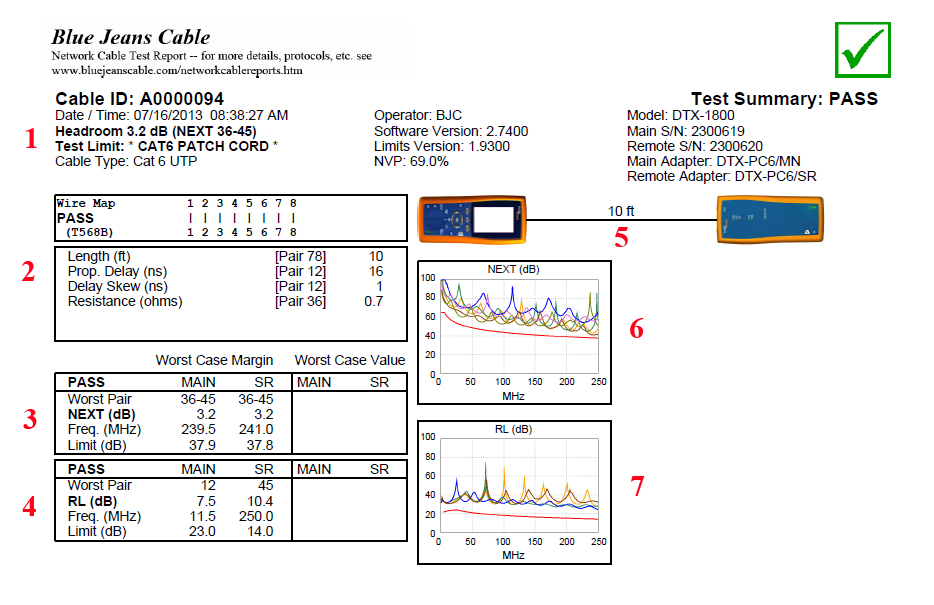
1. Test Limit:
This is the length, in meters, for which the specification limits used in the test were calculated. It should always equal or exceed the actual length of your cable, and represents the next-longer length of cable for which the Fluke tester has a programmed set of limits.
2. Length, Delay, Skew and Resistance table:
This table shows the tester's estimate of the length of the cable (which may not be the same as the actual length--this figure is estimated by measuring electrical delay), the Propagation Delay (i.e., how long it takes a signal to get from one end of the cable to the other) in nanoseconds, the Delay Skew in nanoseconds (the largest difference in Propagation Delay from one pair to another), and the resistance of a pair in ohms (not to be confused with the cable's characteristic impedance, which is always at or close to 100 ohms).
3. Crosstalk (NEXT) Table:
This table identifies the worst near-end crosstalk (NEXT) result in the cable. Crosstalk is the tendency of signals on one of the data pairs to induce a signal on another data pair--it's the same phenomenon that, in the analog world, sometimes causes you to hear another conversation faintly in the background while using the telephone. Crosstalk is tested between each possible pair/pair combination in the cable, and is tested both from the "main" and "remote" tester units, with the results of each reported separately under the columns "MAIN" and "SR". The "Worst Case Value" table, to the right, is always blank on patch cord tests.
"Worst Pair" -- This line shows, with reference to the connector pin assignments, which set of pairs exhibited the worst crosstalk. This frequently (though not always), as here, will be the 36 and 45 pairs, as the 36 pair has to be split due to its being terminated into non-adjacent pins, and lies right over or under the 45 pair in the connector, making these two pairs more prone to crosstalk with one another. The following three lines will show how much headroom over the spec the cable had, and where that headroom was narrowest.
"NEXT(dB)" -- This line does not show the actual NEXT (Near-End Crosstalk) value; rather, it shows the smallest margin, in dB, by which the measured NEXT value beat the testing limit. In this case, the worst result was 3.2 dB better than the specification required. Crosstalk varies with frequency, and the acceptable crosstalk limit varies with frequency also, and this smallest value can occur at any frequency within the tested range. Crosstalk performance elsewhere in the tested range will always be at least as good, and will at many points be much better, than this value. Note that NEXT is expressed as a positive value, and that the higher this value is, the lower the level of crosstalk is; the value represents the number of dB by which the level of the intended signal exceeds the level of the crosstalk. This results in what can seem like a "backward" result: one wants the crosstalk value in dB to EXCEED the spec, not come in under it, because higher dBs equals lower crosstalk.
"Freq. (MHz)" -- This line shows the frequency in Megahertz at which the worst NEXT margin, shown on the line above, occurs. The main and remote units obtained similar results, with the worst frequency being 239.5 MHz in one direction and 241.0 MHz in the other.
"Limit (dB)" -- This line shows the limit, in dB, for NEXT at the frequency shown. Adding this value to the margin shown on the NEXT(dB) line tells you the actual value in dB of NEXT at that frequency in the cable tested.
4. Return Loss Table:
This table identifies the worst pair in the cable for return loss performance, and shows that pair's worst passing margin against the specification's return loss limits. Return loss is the loss caused by signals in the cable reflecting as a result of changes in the impedance of the line.
-"Worst Pair" -- This shows, again by reference to connector pin assignments, which pair had the smallest return loss margin relative to the specification limit.
"RL (dB)" -- This value, as with the corresponding NEXT table above, does not show the return loss value but shows the number of dB by which the worst pair, at its worst frequency, beats the testing limit. In this case, depending on whether one uses the main or the remote data, the smallest margin was 7.5 (main) or 10.4 (remote) dB.
"Freq. (MHz)" -- Return loss varies quite considerably with frequency, and this shows the frequency at which the measured return loss came closest to the allowable limit. As you can see, the smallest margin in this particular case occurred at very different frequencies (11.5 and 250 MHz) depending upon whether the main or the remote testing unit is consulted, but in both cases the margin was excellent.
"Limit (dB)" -- This line shows the allowable limit for return loss at the frequency in question. This number, added to the margin shown in the "RL(dB)" line, gives you the cable's tested return loss value at the frequency in the "Freq. (MHz)" line. Here again, just as with crosstalk, the number may seem backward: if the limit is 20 dB, that means that the tested value should be MORE than 20 dB to pass spec, not less, because a higher dB value means less return loss, not more. To make matters slightly more confusing, some people frame these RL figures in negative dB terms, meaning exactly the same thing as they would mean in positive dB terms--if you encounter specifications which require a negative value for RL, bear this in mind. Such limits, and measurements, are exactly the same but with the opposite sign. In the "positive" case, as on our tester, the number of dB is the signal relative to the RL; in the "negative" case it is the RL relative to the signal; but in either case a larger absolute value (more positive if positive, more negative if negative) than the spec limit is desired.
5. Length Estimate
Here, as in the table to the left, is an estimate of the length of the cable based upon the time it took signals to travel through it. These estimates are generally fairly close but can differ from the measured physical cable length.
6 and 7. NEXT and RL graphs:
These graphs show the NEXT and return loss values, in dB, as they vary by frequency. The horizontal axis is frequency (it will run to 100 MHz for Cat 5e, 250 MHz for Cat 6, and 500 MHz for Cat 6a), and the vertical axis is dB. In each case the relatively smooth, lower red trace shows the testing limits, and the more uneven, bumpy colored traces above show the six pair combinations (for NEXT) or four pairs (for RL), each in a different color. So long as the traces for the pairs and pair combinations stay above the applicable limit line, the cable passes the specification.
One thing you may well wonder, when looking at these, is why they are so lumpy. Instead of smooth, even curves like the limit marker, the traces showing the cable's actual NEXT and RL tend to have peaks and valleys which, for the most part, repeat at regular intervals across the graph. There can be a variety of reasons for this, but the principal one is that the largest "event" as the signal travels through the cable is the impedance bump, and accompanying reorientation of the conductors (causing increased crosstalk) it experiences at the connectors at the each end. Because there are reflections at these points, the cable tends to "ring" at the frequency which corresponds to the cable's physical wavelength, and this means that there will be return loss spikes not only at that frequency, but at all of the harmonic multiples thereof. In longer cables, these spikes tend to be less prominent than in shorter cables; they are no cause for concern as long as they do not cause the cable to exceed specified limits for NEXT or RL.